What Americans Think About The Minimum Wage And Their Governors
Welcome to Pollapalooza, our weekly polling roundup. And this week, we’re switching up the format a little; let us know your thoughts on it (or any other form you’d like to see Pollapalooza take) by shooting us an email.
Raising the minimum wage is popular
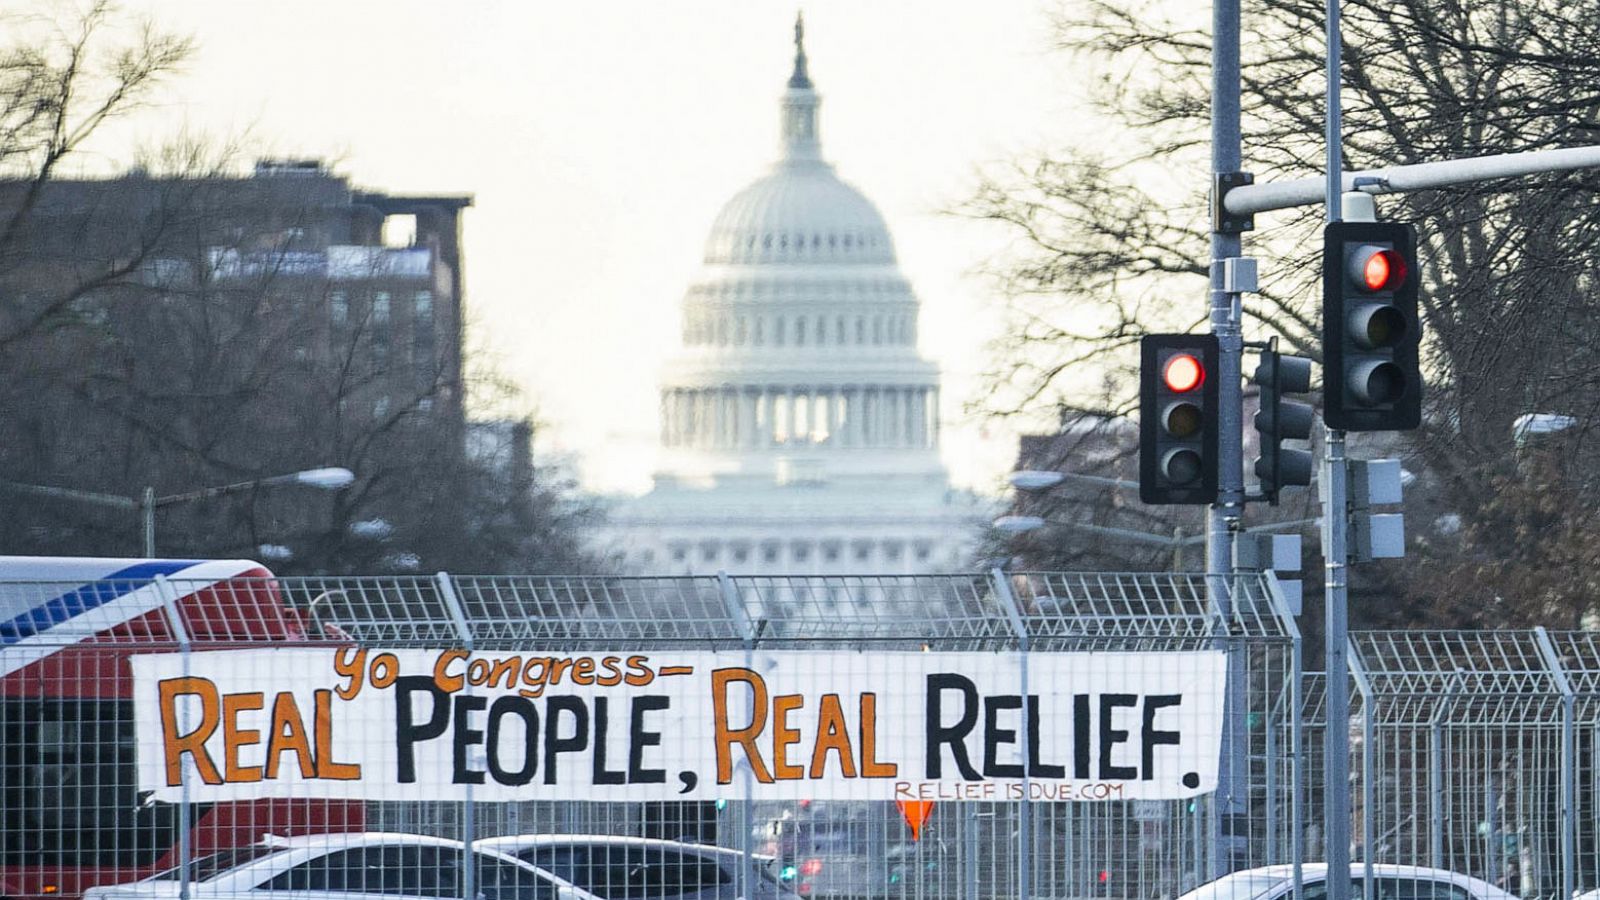
Democrats got some bad news last week when the Senate parliamentarian ruled that the Senate could not include a minimum-wage hike as part of its COVID-19 relief bill. The party’s goal of raising the minimum wage to $15 an hour now faces a more difficult path to passage (had the Senate parliamentarian said it was fine to include, a simple majority in the Senate could have passed it). Now, if the Senate takes it up, it will be as a separate bill that would need to get the support of at least 60 senators.
But arguably, forcing an up-or-down vote on the minimum wage alone is the best leverage its proponents have. Raising the minimum wage is popular with the American public, even as dramatic a raise as to $15 an hour (it is currently $7.25 an hour). This week’s Morning Consult/Politico poll found that registered voters support it 60 percent to 32 percent. An Ipsos/Reuters survey from last month found roughly the same thing: 59 percent of adults in support and 34 percent in opposition. Monmouth University this week did find less support for it, but even in that survey, 53 percent of adults still supported a $15 minimum wage, while 45 percent were against it.
The higher wage’s popularity could put pressure on swing-state Republicans (not to mention hesitant Democrats like Sens. Joe Manchin and Kyrsten Sinema) to vote for it — and if they don’t, Democrats would be able to attack them on it in their next election, so a policy loss could still be a political win.
How popular is your governor?
Between scandals and recall elections and COVID-19, governors have been in the news a lot lately. Perhaps it’s not a coincidence, then, that we’ve gotten quite a few polls of governors’ approval ratings in the past month.
How governors stack up
Share of respondents in 12 states saying they approve or disapprove of their governor’s job performance, according to polls conducted since Feb. 5
| State | Governor | Party | Approval | Disapproval | Net |
|---|---|---|---|---|---|
| MA | Charlie Baker | R | 74 | 20 | +54 |
| NH | Chris Sununu | R | 72 | 25 | +47 |
| UT | Spencer Cox | R | 63 | 22 | +41 |
| TX | Greg Abbott | R | 54 | 35 | +19 |
| WA | Jay Inslee | D | 52 | 35 | +17 |
| FL | Ron DeSantis | R | 55 | 38 | +17 |
| VA | Ralph Northam | D | 49 | 33 | +16 |
| SD | Kristi Noem | R | 55 | 44 | +11 |
| NC | Roy Cooper | D | 49 | 39 | +11 |
| MI | Gretchen Whitmer | D | 52 | 47 | +5 |
| NV | Steve Sisolak | D | 48 | 43 | +5 |
| NY | Andrew Cuomo | D | 48 | 45 | +3 |
Because these numbers come from several different pollsters (and some are of adults while others are of registered voters), be careful making direct comparisons between governors — but we can still draw a few undeniable conclusions. For example, Govs. Charlie Baker of Massachusetts and Chris Sununu of New Hampshire are still extremely popular — despite being Republicans in not-very-red states. And although liberals have lambasted them for their permissive COVID-19 safety protocols, Govs. Ron DeSantis of Florida, Kristi Noem of South Dakota and Greg Abbott of Texas are doing just fine politically, with average net approval ratings1 of +17 points, +11 points and +19 points, respectively. (Note that, in Abbott’s case, the polls were all conducted before this week’s announcement that he’d be fully reopening the state. However, there’s good reason to believe that won’t harm his approval rating much.)
On the other hand, Govs. Gretchen Whitmer of Michigan, Steve Sisolak of Nevada and Andrew Cuomo of New York are divisive figures in their home states. That’s perhaps not too surprising for Whitmer and Sisolak, who hail from swing states and won their 2018 elections by close margins. But Cuomo, who earned near-universal acclaim from New Yorkers just one year ago, has experienced quite a fall from grace amid allegations that he sexually harassed or made unwanted advances toward three women and that his administration deliberately undercounted the number of nursing-home residents who died of COVID-19 for political gain. Only two surveys have been conducted since the sexual-harassment scandal gained traction (the numbers above are based on an average of those polls and three older ones), but they contained some of Cuomo’s worst numbers yet: Emerson College/WPIX-TV/NewsNation gave him a 38 percent approval rating and a 48 percent disapproval rating, and Quinnipiac University put him at 45 percent approval and 46 percent disapproval.
[How Americans View Biden’s Response To The Coronavirus Crisis]
Several polls asked respondents separate questions about whether they approved of their governor’s handling of the pandemic, and the numbers generally tracked closely with their overall approval ratings. However, it’s hard to know which is influencing the other here. It’s possible that Americans are primarily judging their governors on their coronavirus performances (and thus basing their overall job approval on how they view their governors’ handling of the pandemic) or that Americans are judging governors’ coronavirus performances on whether they support them overall (and thus basing their approval of their governors’ handling of the pandemic on how they view their governors more generally).
Ignore the CPAC straw poll
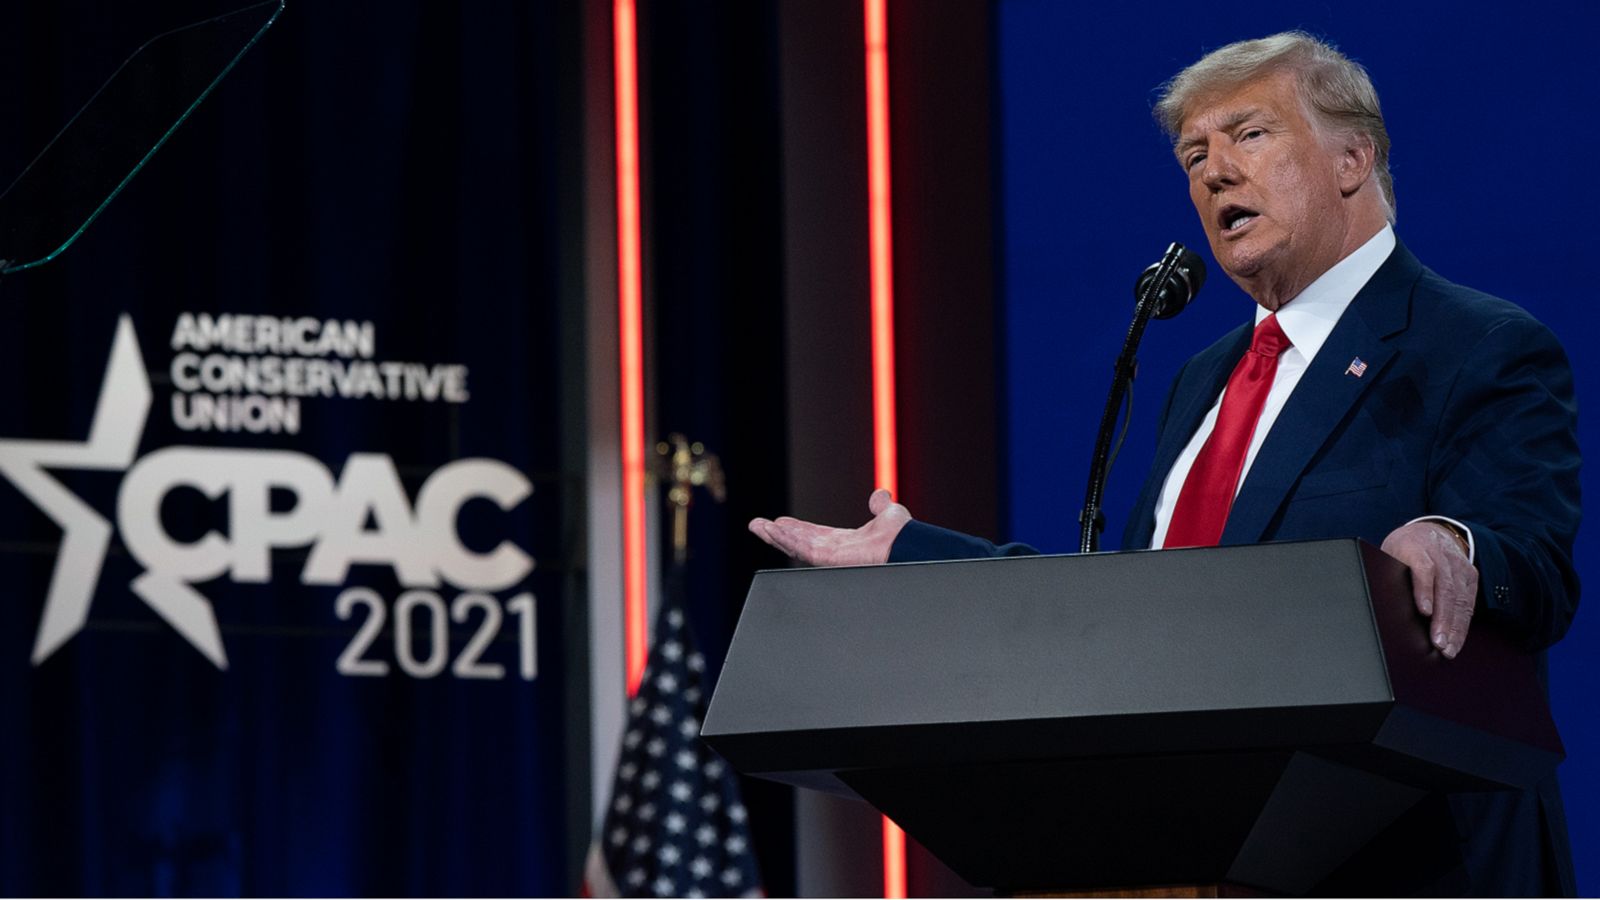
On Sunday, headlines blared the results of the annual Conservative Political Action Conference straw poll, which found that 55 percent of CPAC attendees wanted former President Donald Trump to be the Republican presidential nominee in 2024. (DeSantis finished second with 21 percent, and Noem was third with 4 percent.) But unfortunately, those headlines did not add some important caveats: The CPAC straw poll is not a scientific poll, and it is not at all predictive of who will actually win the next GOP presidential primary — especially three years beforehand.
In the nearly 50-year history of CPAC, its straw poll has correctly picked the next Republican presidential nominee only six times.2 And most of those times, it was an easy choice: Either the straw poll was happening amid the presidential primaries in the election year itself (1980, 2000, 2012) or there was an incumbent Republican president who was obviously going to be the nominee (1984, 2019). There was only one time the straw poll accurately predicted the nominee this far out (Mitt Romney in 2009). More often, the straw poll winner is someone with special appeal to the activist Republicans who typically populate CPAC, such as Rand Paul in 2013 or Jack Kemp in 1993, rather than someone with broader appeal to voters.
Trump may be the Republican standard-bearer again in 2024. Or he may not. But don’t pay any attention to the CPAC straw poll when trying to guess which it’ll be.
Biden approval

According to FiveThirtyEight’s presidential approval tracker,3 52.7 percent of Americans approve of the job Biden is doing as president, while 38.6 percent disapprove (a net approval rating of +14.2 points). At this time last week, 54.5 percent approved and 38.2 percent disapproved (a net approval rating of +16.3 points). One month ago, Biden had an approval rating of 53.8 percent and a disapproval rating of 35.8 percent, for a net approval rating of +17.9 points.

Source: https://fivethirtyeight.com/features/what-americans-think-about-the-minimum-wage-and-their-governors/